Key Points:
- The last two recessions produced major bear markets for stocks.
- The two bear markets were surprisingly different from one another.
- Both bear markets proved the value of diversification.
Most of us have read about the benefits of diversifying our investments. The key benefit, in theory, is that when some assets decline, others will go up at least partially reducing the pain of a serious market downturn.
Bear Markets and Retirement Plans
There have been countless articles written about how diversification should theoretically create a more stable investment portfolio and therefore a more stable retirement plan. The goal should be to find investments that are not correlated with each other in serious market downturns. Taking it a step further, what really helps is having assets that are negatively correlated in bear markets.
Going back to the theoretical, Monte Carlo analysis takes all of this into account. In Monte Carlo analysis of a retirement plan, there are hundreds if not thousands of different scenarios that look at past data for asset returns, volatility, and correlations among the assets. These scenarios should also incorporate recessions as well as major bull markets where asset returns are way above normal.
Let’s take a look at a retirement plan in WealthTrace to show the value of diversification. I looked at a couple that is 50 years old and plans on retiring at age 65. They have $200,000 in taxable investments and $700,000 in IRAs. They plan on spending $85,000 per year in retirement. In my first run of their plan, I placed them 100% in stocks that are 100% correlated with each other in a market downturn. I found the following:
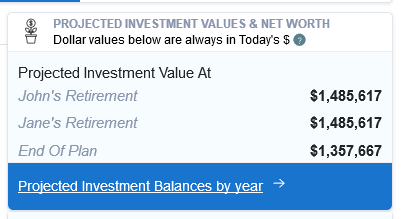
Having nearly $1.5 million at retirement and nearly $1.4 million at the end of their life expectancy sounds pretty good. But these results assume returns never change over the life of the plan. Even if a couple is projected to have $2 million or $3 million at retirement, their retirement plan still might not be safe from serious market downturns. This is why we also need to use Monte Carlo analysis.
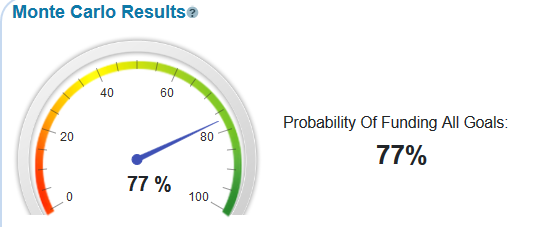
The Monte Carlo results tell us that in 23% of the scenarios run for this couple’s retirement plan, they run out of money. This result is bad enough to keep them up at night. So what can they do? Will diversifying help them?
To test this I moved half of their money into long-term treasury bonds when they retire. I also diversified their stock holdings among several sectors that are correlated with each other, but not 100% correlated like they were before. In this instance, I found that their Monte Carlo probability of success goes up to 83%.
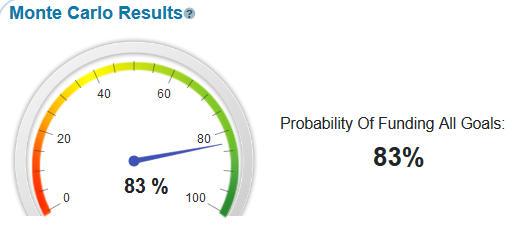
This result is not too surprising. The treasury bonds in their portfolio go up in value when the stock portion goes down. When stocks really decline during bear markets, the bonds do even better due to the nature of their negative correlation with stocks.
The Recession Of 2001
Let’s now move from theoretical to more tangible, historical events. The recession of 2001 was a painful one for those invested in the tech sector and stocks in general. But “growth” stocks, especially in the tech sector, were hit the worst by far. From the peak in 2001 to the trough at the end of the year, we saw the following returns for these asset classes:
| Value Stocks | -28% |
| Growth Stocks | -50% |
| International Developed Stocks | -37% |
| Emerging Market Stocks | -27% |
This recession was unique in that emerging market stocks actually outperformed all of the other equity sectors. This is normally not the case in serious market downturns. But each recession and bear market are different, which is why it is beneficial to be able to model a variety of actual bear markets.
Here is what happened to treasury bonds during this recession:
| Short-Term Treasury Bonds | 14% |
| Medium-Term Treasury Bonds | 21% |
| Long-Term Treasury Bonds | 22% |
Using the WealthTrace Planner, I modeled what would have happened to the plan for the couple we looked at earlier if we have a downturn just like the one in 2001. The software has a what-if scenario that allows users to model what would happen to their retirement plan if there is a bear market. Users can modify the returns that occur for one year during a downturn. Users can also set the year in which the downturn occurs.
I set the returns for the bear market scenario exactly to the returns shown above for the 2001 downturn. I also set their portfolio back to the 100% stock portfolio.
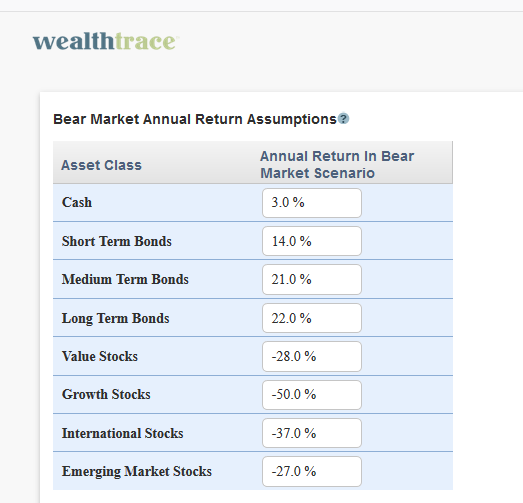
I then ran the bear market scenario where the bear market hits two years from now. Remember, the returns above are applied for one year only and then they go back to their mean values.
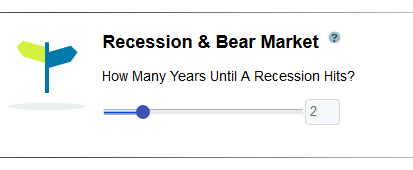

Their overall portfolio value goes down by more than 50% by the end of their life expectancy. Even more interesting is that their Monte Carlo probability declines 22 percentage points from the base case.
Their overall portfolio value goes down by more than 50% by the end of their life expectancy. Even more interesting is that their Monte Carlo probability declines 22 percentage points from the base case.

Their overall portfolio value goes down by more than 50% by the end of their life expectancy. Even more interesting is that their Monte Carlo probability declines 22 percentage points from the base case.
Their overall portfolio value goes down by more than 50% by the end of their life expectancy. Even more interesting is that their Monte Carlo probability declines 22 percentage points from the base case.
Some might be asking, “But doesn’t Monte Carlo already incorporate market downturns like this?” Yes it does! So why also add on top of it another bear market? When we run this scenario we are effectively saying that we 100% guarantee there will be a bear market in two years. After that, in Monte Carlo analysis, there can and will still be more bear markets in various scenarios as determined by historical volatility and correlations for the asset classes. But by applying the bear market scenario, we also ensure there is a market downturn when we want it to happen.
Put another way, Monte Carlo analysis is about the probabilities of various events occurring. Market downturns only occur in some of the Monte Carlo simulations. The bear market scenario tells the program there will definitely be a market downturn and a possibility of more in the future.
So what happens if this couple was more diversified? I set their allocation to a mixture of 60% stocks and 40% bonds spread across all of the different asset classes. I ran the scenario again and found the following:

We can see that all of the values changed, but what is most important is the difference in the Monte Carlo Probability. It only went down by 10 percentage points compared to 22 previously. This is due to the diversification between stocks and bonds. Bond returns actually went up significantly in the 2001 recession and this helped blunt the impact of the bear market in stocks.
The Recession of 2008/2009
The recessions and bear market in 2008 and 2009 were worse than the one in 2001. In fact, this recession has been referred to as the “Great Recession”. You can see below how the different asset classes performed during this time vs. the 2001 recession.
| 2008/2009 | 2001 | Difference |
| Short-Term Treasury Bonds | 7% | 14% | -7% |
| Medium-Term Treasury Bonds | 16% | 21% | -5% |
| Long-Term Treasury Bonds | 17% | 22% | -5% |
| Value Stocks | -55% | -28% | -27% |
| Growth Stocks | -48% | -50% | 2% |
| International Developed Stocks | -59% | -37% | -22% |
| Emerging Market Stocks | -61% | -27% | -34% |
The numbers for the most recent recession are pretty jarring. Every single asset class performed worse than they did in the 2001 recession except for growth stocks. And even this was only a 2% difference. Also of note is the stronger correlation among all equity markets during this most recent downturn. The entire world saw a severe market downturn, which was not the case in 2001.
I set my bear market return assumptions to the 2008/2009 downturn. I then put this couple’s asset allocation back to 100% in stocks.

Now that is a bad year. Their probability of plan success drops to a frighteningly low 29%. This is nearly a 50 percentage point drop from the base case.
To finish the analysis I then set their portfolio to the more diversified 60/40 mix as I did before.

It’s still bad, but not nearly as bad from a probability perspective. Once again, this shows the value of diversification.
What about the Rebound?
In the past two recessions the stock market snapped back dramatically. The bear market scenarios run above do not take this into account. But there is a way in the WealthTrace software to model this. I kept the bear market assumptions set to the 2008/2009 recession. I then added in the following:
 I created a user-defined scenario where annual returns increase by 0.5% after the bear market occurs. The returns will be 0.5% higher until this couple retires in 15 years.. Then the returns go back to their default average values. This is one way to model a rebound in the market. The results are below.I created a user-defined scenario where annual returns increase by 0.5% after the bear market occurs. The returns will be 0.5% higher until this couple retires in 15 years.. Then the returns go back to their default average values. This is one way to model a rebound in the market. The results are below.

The bear market scenario now produces a Monte Carlo probability of success that is 7 percentage points higher than it was previously.
It’s Good to be Prepared
Many people underestimate the impact a severe recession can have on their investments and their future plans. Running scenarios using actual past historical data is a great way to see how your financial plan would hold up under similar scenarios. Only looking at static returns that never change for the life of a plan is dangerous and will not give you an accurate picture of the risks you might be facing.
Do you want to see how your investments and retirement plan would hold up under various scenarios? Sign up for a free trial of WealthTrace to find out.